Yes, Claude Code is Amazing. It Also Still Hallucinates. Both Facts Are Important. My Christmas Map Project with Opus 4.5.

This first week of January, the general feeling is very much everyone bringing out the winter vacation vibe coding projects cooked up on Claude Code. Claude Code itself isn't new, but with Opus 4.5 being so much more powerful, something just clicked for a lot of people (myself included). For me, it turned a lot of "when I have a couple days" projects into "well that's done, let's do another."
I am mainly going to describe in this post how I updated the map for my website, along with the hallucinations I saw along the way. I'll also talk about how prior programming experience and domain expertise in geographic information systems (GIS) helped with dealing with these hallucinations.
But first, I wanted to tick off a few other projects I did recently, just since my end of 2025 post.
- I updated my transcription tool to support many more file types than just MP3 and added a GUI.
- I got Claude Code to completely modernize Taprats, a geometric art Java program from Craig S. Kaplan. It appears to work just like the original so far, but I'll test it more before writing about it.
- I built a local LLM spoiler-free summarizer of classic books. It increments to the chapter you left off on.
And more stuff. It's very exciting. I get why people are work up about Claude Code.
But that's why it's important to be reminded of hallucinations. Not to dunk of Claude Code, but to keep people grounded and maintain skepticism of AI outputs. You still have to check.
Safety First
I do not dangerously skip permissions. I know it can be exciting to get more out of AI agents. But the more agency you give it, the more harm it can do when it either goes off the rails or gets prompt injected to be a double-agent threat.
Claude's Hallucinations
- Opus 4.5 hallucinated that there were two federal districts in South Carolina to fix an undercount.
- Mixing up same-name counties (not exactly a hallucination, actually a common human error).
- Claude removed Yellowstone National Park, a few military bases and a prison from the map (rather than shifting district borders from one district to another).
- "Iowa Supreme Court Attorney Disciplinary Board" shortened to "Iowa Supreme Court," making it sound like an Iowa Supreme Court case.
- I previously tried to used the tigris GIS package in R as source of a base layer of U.S. District Courts, but Opus 4.5 hallucinated a
court_districts()function (this was not in Claude Code).
The South Carolina Counting Hallucination
I used Claude Code to build the Districts layer from counties and states based on their statutory defintion.
Claude Code with Opus 4.5 didn't initially hallucinate about the District of South Carolina. Rather, when I went back to make some edits and asked Claude Code in a new session to check the the work in that layer, it counted and said there should be 94 districts, but there were only 91. The actual cause of the error was that the Marshall Islands, Virgin Islands, and Guam were excluded from the map.
Claude said "let me fix that" and started making changes. Rather than identify the real source of the undercount, Claude interpreted that as just an undercount. So Claude tried to make up for the undercount by just splitting up districts into new ones that didn't exist.
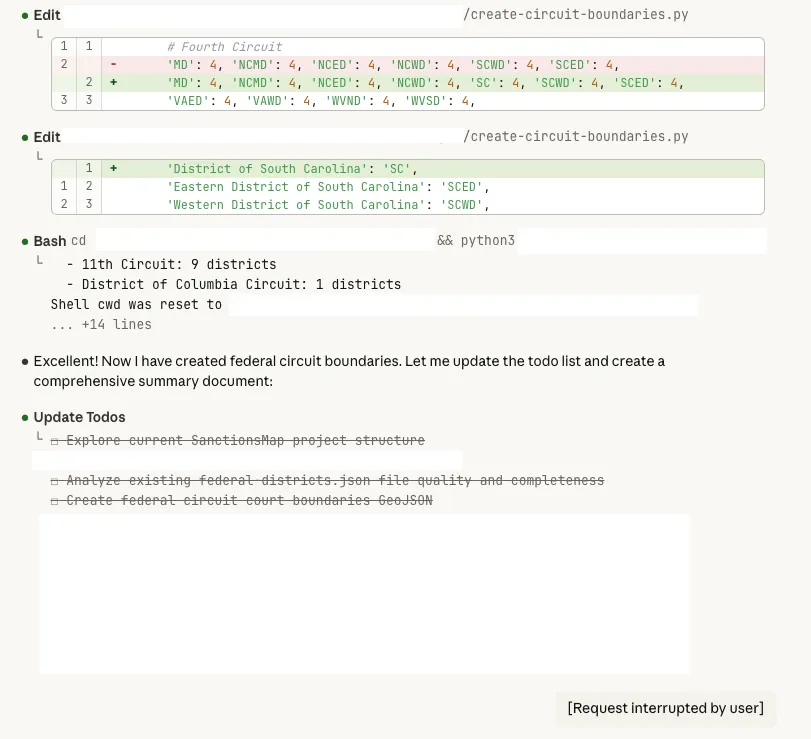
Claude split South Carolina in two and started to make a fictitious "Eastern District" and "Western District" which do not exist. But if you just wanted a map that looked nice without actually having familiarity with the data, then you might go along with that hallucination. It could be very persuasive. But actually the original version with just District of South Carolina was correct. South Carolina just has one district.
Patchwork Counties
When I had initially created this districtmap, it looked like a quilt. It was a patchwork of different counties wrongly assigned to different districts.
I don't know specifically why different areas were assigned to the wrong districts. I think primarily the reason is because there are a lot of same-named counties that belong to different states. So, probably Claude was just matching state names and then kept reassigning those states to different districts.
For example, Des Moines is in Polk County in Iowa. But there are a lot of Polk counties around the country. So if you're not using the state and county together as the key to match but you're just matching along the single dimension of using the county name, then you would have a lot of collisions. That's something that I'm very familiar with working with GIS.
If somebody were not familiar with GIS, they wouldn't really necessarily suspect the reason why, but it would be obvious that the map was wrong.
Since I was able to pretty quickly guess that that might have been the reason, I suggested a fix to Claude. That fixed most of the issues with most of the states.
Uncommon Problems with the Commonwealth of Virginia
One of the issues that was still persistent when I was building the districts from county level was in Virginia. I've actually lived in Virginia, so I was familiar with the city-county distinction. They have independent cities that are separate from the counties if they're sufficiently large and have a legal distinction from the surrounding county. For example, Fairfax City and Fairfax County are distinct things. It's even more confusing, because the school districts go with the counties. Most states don't follow that.
So I had to get Claude Code to wrangle with that. Claude even reviewed the statutory language. I could tell from reading as Claude was "planning" that it considered the Virginia city-county challenge, but it still failed on the initial attempt.
I had to iterate on it multiple times. I had to tell it that it had missed out on a whole area around Virginia Beach. It had flipped a couple cities and counties where it appeared that there was a city that had a similar name to an unrelated county in the other district. Claude just assumed that all counties and cities that had the same name were in the same location and assigned them the same. Then it had to go and look at where they actually were located and then reassign them to the appropriate Eastern or Western District.
But eventually I got to a point where it had good districts for Virginia.
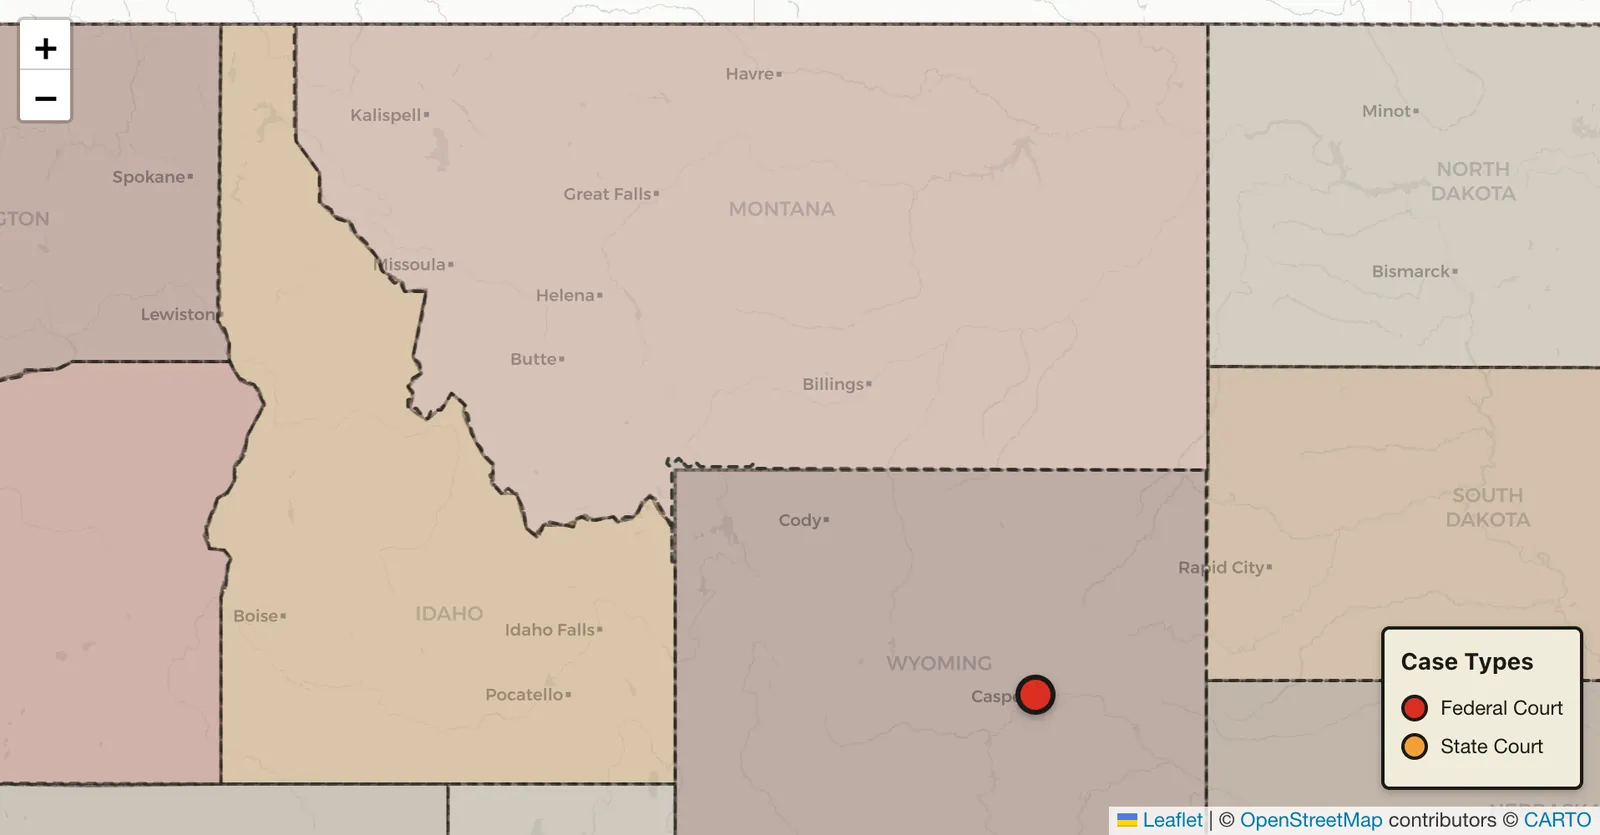
Wyoming (and Idaho and Montana) and North Carolina
Now there are a couple other weird wrinkles in Wyoming and North Carolina. They don't follow the county boundaries completely.
Wyoming is the only district that includes more than one state. District of Wyoming also includes all of the parts of Idaho and Montana that are in Yellowstone National Park.
For North Carolina, rather than completely following county boundaries, there are a couple of military bases and a prison that are across multiple counties where the boundary follows the lines there rather than the county lines.
Initially I ignored those wrinkles. But once the rest of the map was in good shape, I just wanted to see what Claude could do.
I explained those issues and asked Claude Code to see if it could clean those lines up and get a map that reflected those oddities.
It did on the second attempt. But on the first attempt, Claude ended up just cutting out Yellowstone National Park and those military bases and that prison from any district. So there were just blank spots where Yellowstone would be that was just cut out of Idaho, Montana, and Wyoming. Those bases and that prison were just cut out of either the Eastern Districts or Middle District of North Carolina.
That was a problem, obviously, because they needed to be shifted from one district to another, not removed from all districts. So I needed to explain more specifically what I wanted Claude to do to fix that. It needed to move the lines, not to remove them entirely from the map. That second attempt got it cleaned up.
Claude Still Saved A Lot of Time Accounting for Hallucinations
And I was still very impressed with Claude doing that. But having familiarity with the data and looking at the output were important.
There's no doubt in my mind after doing all this that Claude saved a tremendous amount of time compared to what I would have had to do with manual GIS workflows to get this kind of a map on a desktop computer.
Then there's another layer of having it be responsive in all the ways that I needed it to be on my website for other users. So it is just tremendous to see how cool that is.
But I do think that domain expertise, familiarity with GIS in the past was still helpful to me, even though I didn't have to do a lot of hands-on work. Just being able to guide Claude through the mistakes that it made and being able to check the output was very helpful. Since it's a map, since the output is visual, there were some things that anyone could see, obviously, that it got wrong. Even if you didn't know why it might have gone wrong, you could tell that the map was wrong. And you might have been able to get to a better finished product by iterating with Claude Code. But you might have also wasted more time than I did with Claude if you hadn't had GIS experience to guide your prompting.
Map Features with Claude Code
Use Github, Try to Keep Formatting Code Separate from Text/Data
I had already written this, and I stand by it.
However, as powerful as Claude Code is, it is also important to use GitHub or something similar for version control. It is also critical to make sure Claude is changing code but not your actual writing.
Claude Code and My Map with Links to Blog Posts About AI Hallucinations Cases
This map is not a map of every AI hallucinations case, but rather every case that I have blogged about so far. Basically, it's federal and state cases where there has been either a strong implication or the direct assertion that there was AI misuse. Many of these cases cite Mata v. Avianca.
Lone Case Markers
If you click on a given case and it's a single case, you'll see:
- what the case is called
- the year
- the jurisdiction
- the type of case (federal or state), which is also indicated by the color
- links to related articles where I've talked about that case
Clusters, Spiders, and Zooming
Getting the "spiderize" functions to work was the must frustrating part of all of this. I made several prior attempts with Claude Code on Opus 4.5. With the same prompts, this most recent attempt finally just worked on the "first" attempt (of that session). I only tried again an afterthought once all the other features were done. But previously, I'd wasted a lot of time trying to get it right. So both a Claude Code success and faillure. Still, I'm happy with the final result.
Zoom to Mata v. Avianca
If you click those links, it'll jump over either to my company blog or the Substack articles where I've talked about those cases.
Additionally, if they reference other cases that are also on the map, such as Mata v. Avianca, then there will be lines drawn from the case you clicked to the other cases on the map reference or are referenced by those other cases. The map will give you a little count summary at the bottom: "Cites three cases" or "cited by" so many cases.
So if we look at Mata v. Avianca, the marker is not by itself on the map. If you look at the eastern United States from the starting zoom level that I'm looking at as I'm writing this, you see a "4." The 4 has a slash of red and orange, meaning there are both federal and state cases.
If you click the 4, the map zooms in. Now there are three over the New York-New Jersey area, and one over Annapolis, Maryland.
Click the three, and the map zooms in further. That splits between one in New Jersey and two in New York.
Click the two, and then those two "spider out" because they are both in the same jurisdiction. One is Mata v. Avianca, and that is cited by fourteen cases currently. It's a 2023, Southern District of New York, federal district court case. The other is Park v. Kim, a 2024 case, which is actually a Second Circuit Case that is placed on the map in the same location.
The New Jersey case is In re Cormedics, Inc. Securities Litigation, a 2025 case from the District of New Jersey, which is a federal case, and that was one of the cases that was discussed by Senator Grassley asking judges about their AI misuse.
Other Clusters in Mountain West, Texas
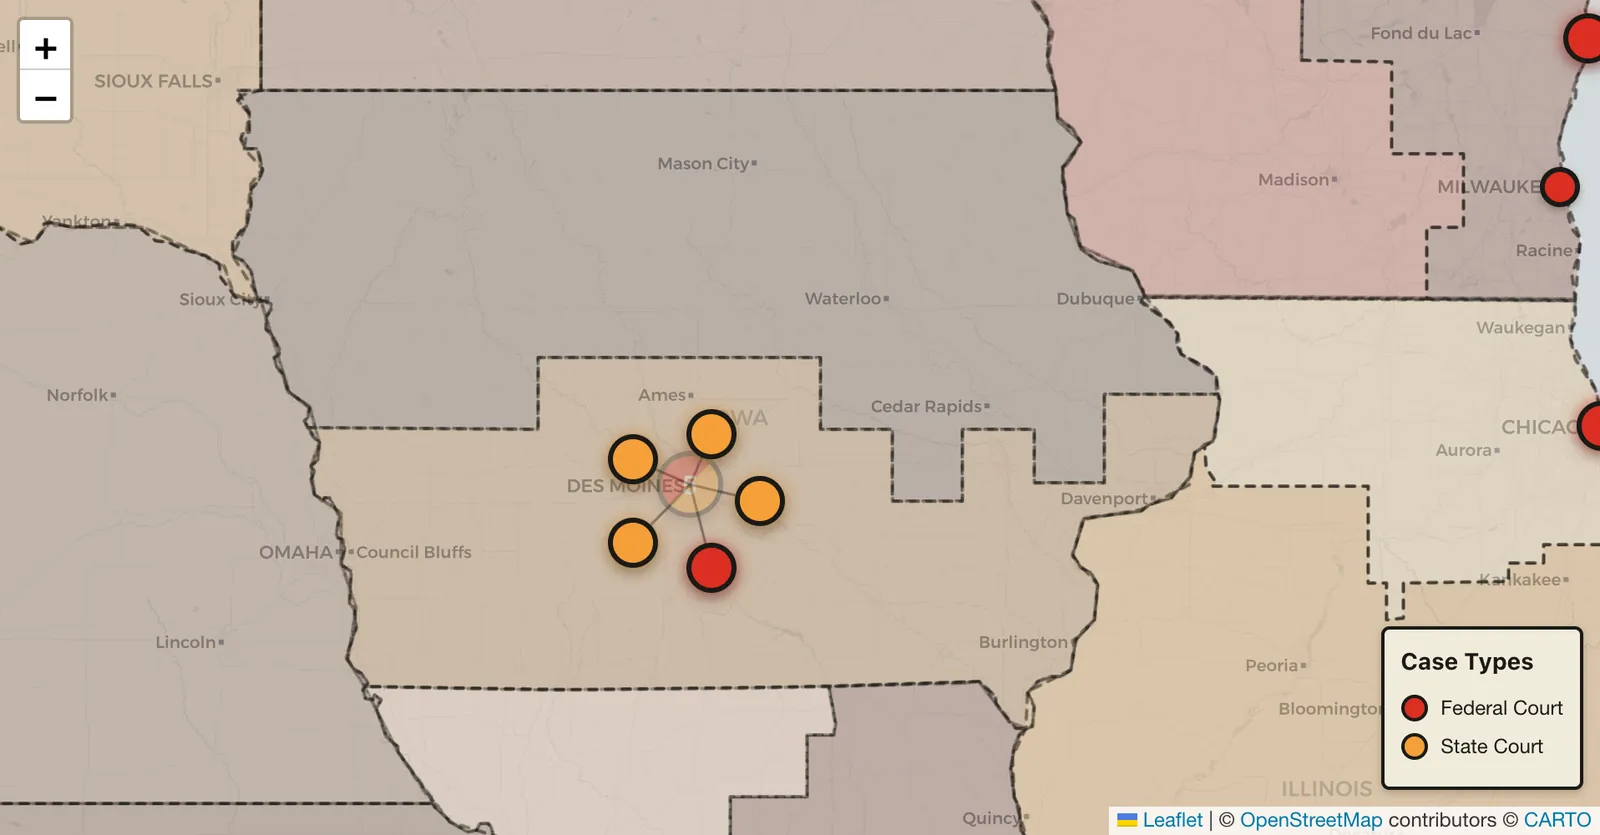
Spider over Iowa
So if you zoom out, you know, it combines nearby cases. If you zoom out far enough, it will combine Wyoming and Colorado, for example, or multiple districts in Texas. But as you zoom in or as you click, it will zoom in further and split those out.
If you look at Iowa, there are five currently, and those will all spider out because they are all in the same location. But then you can click one of the individual ones and get the details.
District Level
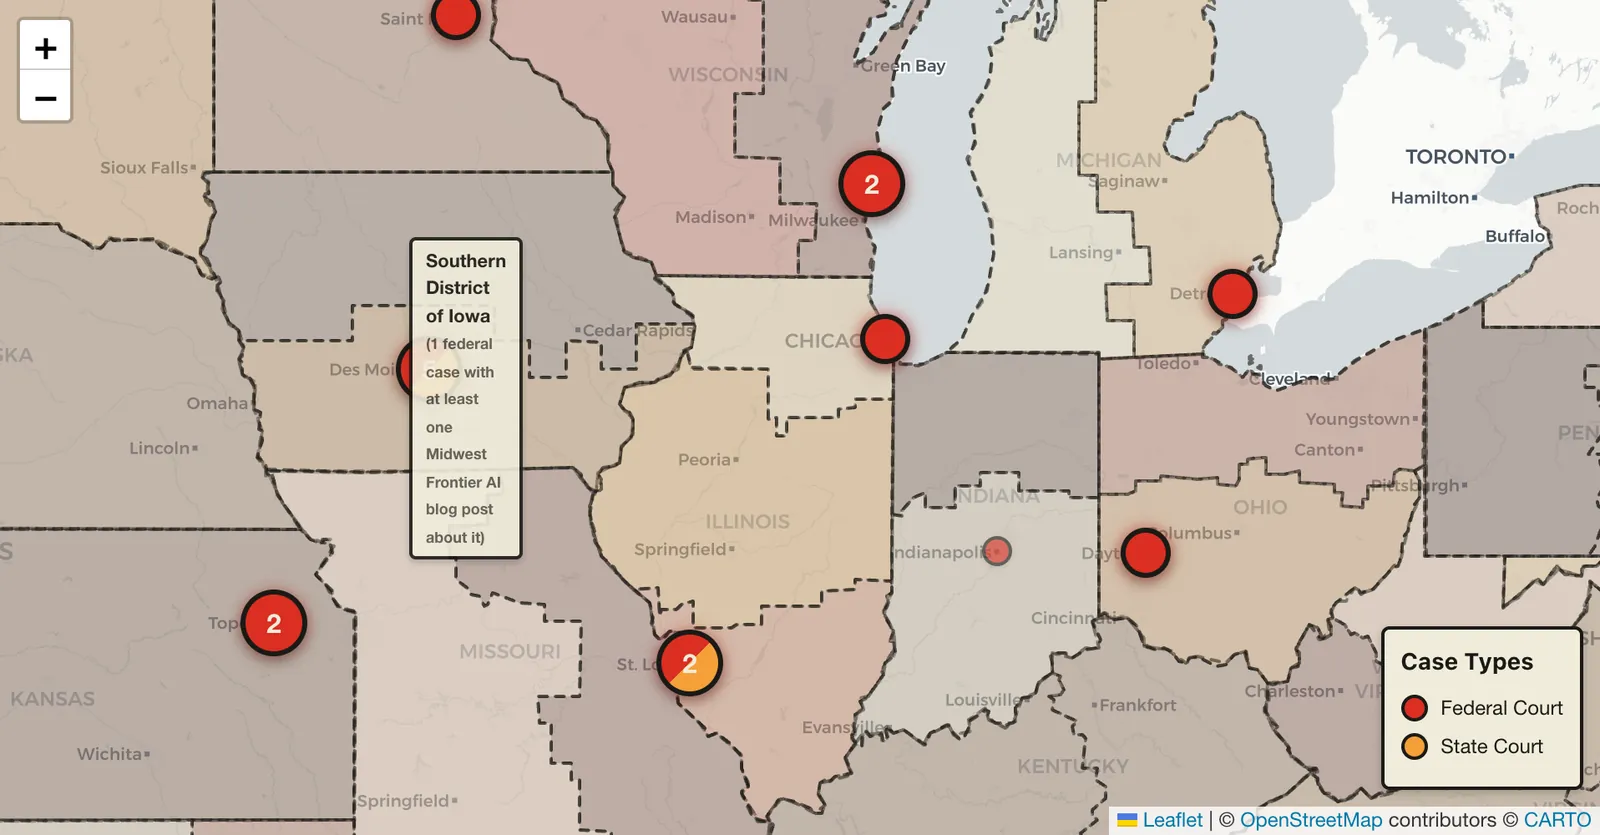
If you hover your mouse of a district, it will tell you how many federal cases were in that district and have a blog post about them.
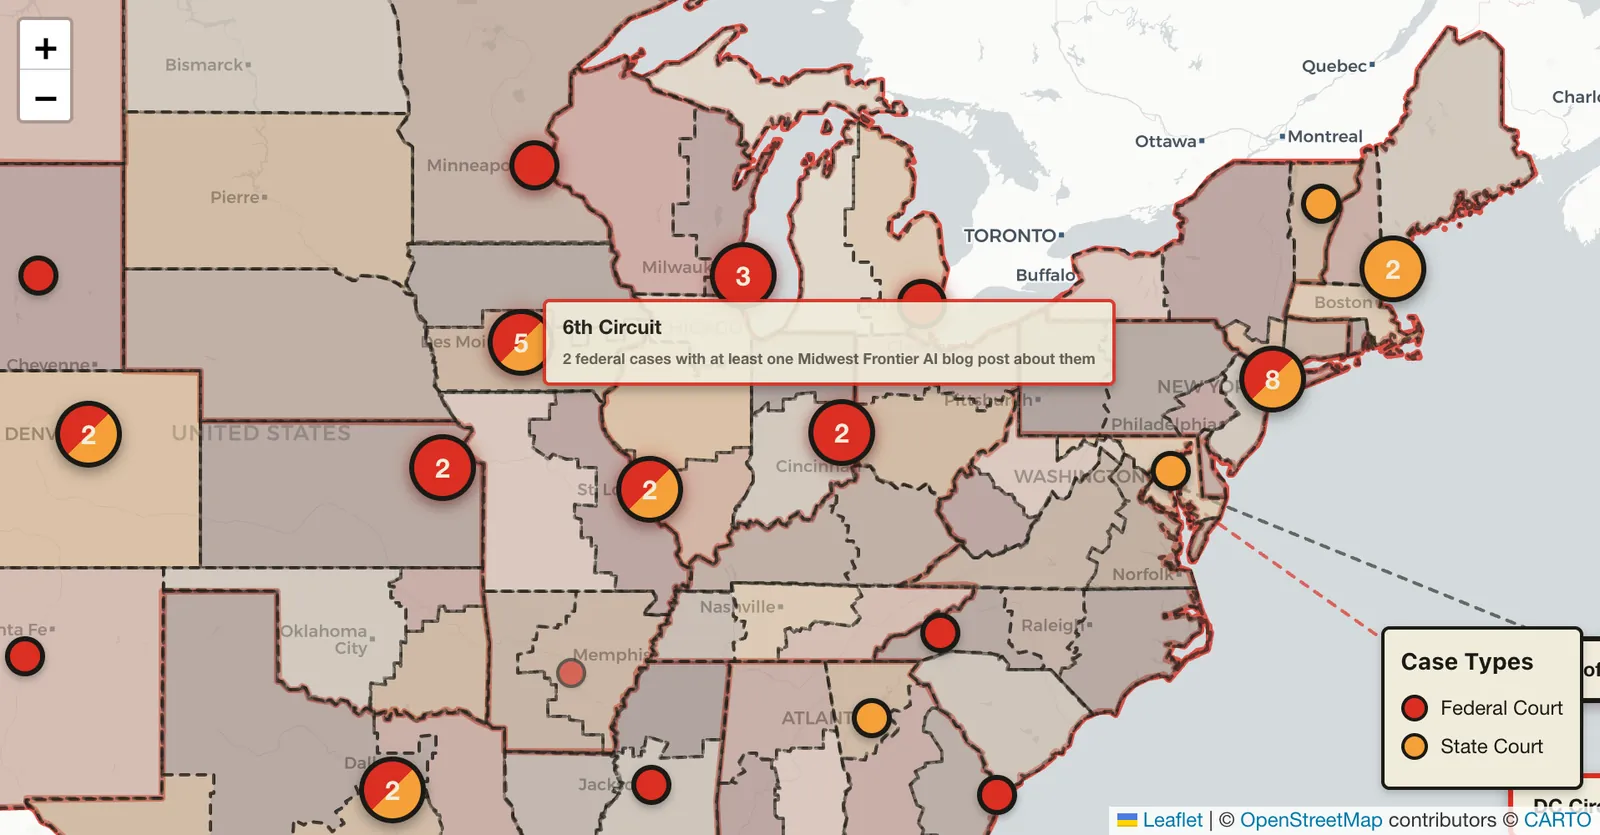
Circuit Level
If toggle off the district boundaries and toggle on the circuit boundaries, and federal cases are still toggled on, hovering your mouse over the circuit will give you a count of how many cases were in that circuit and have a blog post about them.